Online Course Analytics: What to Track After You Launch
 David Zenler
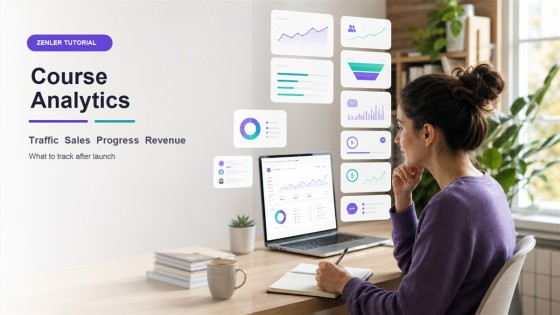
Learn which online course analytics to track after launch, including traffic, opt-ins, sales, email clicks, lesson progress, video drop-off and revenue.
Quick answer: After launching an online course, track analytics across the full journey: traffic, opt-ins, email engagement, sales conversion, checkout revenue, lesson progress, video drop-off, student questions and refunds. These numbers show what to improve next.
A course launch is not finished when the sales page goes live.
Launch is the beginning of feedback. Analytics show where people pay attention, where they hesitate, where students make progress and where your offer needs improvement.
Why Online Course Analytics Matter
Analytics help you improve the course business instead of guessing.
Good tracking can answer questions like:
- Which traffic source brings the right people?
- Which lead magnet converts?
- Which emails drive sales?
- Which sales page needs work?
- Where do students stop learning?
- Which offer creates the strongest revenue?
The New Zenler course analytics page is the current source-of-truth reference for analytics capability.
Metric 1: Traffic Quality
Traffic volume matters less than traffic quality.
Track which pages, posts, videos, emails or ads bring people who actually opt in, buy or engage. If traffic grows but leads and sales do not, the content may be attracting the wrong audience.
Metric 2: Opt-In Conversion
Opt-ins show whether your free resource or workshop promise is strong enough.
Track:
- Landing page views.
- Form submissions.
- Conversion rate.
- Lead source.
- Follow-up email clicks.
Use the New Zenler sales funnel software page as the source-of-truth reference for funnels and lead paths.
Metric 3: Email Engagement
Email analytics show whether your follow-up is building trust.
Track opens, clicks, replies, unsubscribes and which emails lead to checkout visits.
The current New Zenler email marketing tool page is the source-of-truth reference for email capability.
Metric 4: Sales Page Conversion
Your sales page conversion rate shows whether the offer, promise and page structure are doing their job.
Watch:
- Sales page visits.
- Checkout clicks.
- Completed purchases.
- Refunds.
- Payment plan uptake.
For a deeper funnel view, read the course launch funnel guide and the complete New Zenler course funnel tutorial.
Metric 5: Revenue Per Offer
Revenue analytics help you see which offers are working.
Track revenue by course, membership, bundle, payment plan and coupon. This helps you decide what to promote, improve or retire.
If pricing is part of the issue, use How to Price an Online Course as a related guide.
Metric 6: Lesson Progress
Student progress analytics show whether people are moving through the course.
Track:
- Course starts.
- Lesson completions.
- Module drop-off.
- Time to first action.
- Completion rate.
The New Zenler online course platform page is the current source-of-truth reference for course delivery.
Metric 7: Video Drop-Off
Video drop-off helps you improve lessons.
If students leave at the same point in a video, the lesson may be too long, unclear or missing context. Use that signal to shorten, split or improve the lesson.
Metric 8: Automation Performance
Automation should support the learner journey.
Track whether the right emails, tags, enrolments and follow-ups are firing at the right time. The New Zenler automation page is the current source-of-truth reference.
Metric 9: Support Questions
Support questions are analytics too.
If many students ask the same question, improve the lesson, onboarding email, FAQ, community prompt or sales page.
For early-stage support, pair analytics with the student onboarding sequence.
A Simple Weekly Analytics Review
- Check traffic and opt-ins.
- Review email clicks.
- Check sales and checkout conversion.
- Review student starts and progress.
- Look for lesson or video drop-off.
- Read support questions.
- Choose one improvement for the next week.
Conclusion
Online course analytics are not just reports.
They are the feedback loop for your creator business. They show what attracts, what converts, what teaches and what needs improvement.
For the bigger system view, read The Creator Business Operating System.
FAQ
What online course analytics should I track first?
Start with traffic, opt-ins, sales conversion, revenue, lesson progress, video drop-off and student support questions.
How often should I review course analytics?
A weekly review works well after launch. Look for one useful improvement each week instead of trying to fix everything at once.
Why is lesson progress important?
Lesson progress shows whether students are actually using the course. Low progress can point to unclear onboarding, weak motivation or lessons that need improving.
Can analytics improve course sales?
Yes. Analytics can show which traffic, emails, funnels and offers drive sales, so you can improve the parts that matter most.
Categories: : Zenler Tutorials
Copyright © 2026 Zenler. All rights reserved.
Terms | Privacy Policy | Cookie Policy | Support